I always forget how to do it.
%let nagasuchi=cases;
data new;
set library.old&nagasuchi;
This would be read as
data new;
set library.oldcases;
If the macro variable is a prefix
data new;
set library.&nagasuchi.old;
/* note the period*/
This would be read as
data new;
set library.casesold;
If the character following a macro variable is a period, then you need to use two periods.
set in&nagasuchi..select;
After resolution, SAS would read this as SET incases.select;
More on this here.
Wednesday, June 27, 2007
Friday, June 15, 2007
LaTeX output in sas
/*Use one of the following ods statements */
/* Legacy LaTeX for ODS */
ods tagsets.latex file="legacy.tex";
/* Legacy LaTeX with color for ODS */
ods tagsets.colorlatex file="color.tex" stylesheet="sas.sty"(url="sas");
/* Simplified LaTeX output that uses plain LaTeX tables */
ods tagsets.simplelatex file="simple.tex" stylesheet="sas.sty"(url="sas");
/* Same as above, but only prints out tables (no titles, notes, etc.) */
/* Also, prints each table to a separate file */
ods tagsets.tablesonlylatex file="C:\Documents and Settings\mk\My Documents\tablesonly.tex" (notop nobot) newfile=table;
proc reg data=sashelp.class;
model Weight = Height Age;
run;quit;
/*Use one of the following ods statements corresponding to open statements*/
ods tagsets.latex close;
ods tagsets.colorlatex close;
ods tagsets.tablesonlylatex close;
ods tagsets.simplelatex close;
/*from SAS*/
Thursday, May 3, 2007
Unix Banner for interesting titles
ASCII Banner 1 , 2
.'|. . '||
Have fun. Don´t forget to bookmark this website :)
.||. .... .||. .... .... .. ... .. ||
|| '' .|| || ||. ' '' .|| || || .' '||
|| .|' || || . '|.. .|' || || || |. ||
.||. '|..'|' '|.' |'..|' '|..'|' .||. ||. '|..'||.
||
.... .. ... ... . ... .. ... ....
'' .|| || || || || || || || '' .||
.|' || || || |'' || || || .|' ||
'|..'|' .||. ||. '||||. .||. .||. ||. '|..'|'
.|....' __ _ _ _
/ _| __ _| |_ ___ __ _ _ __ __| | __ _ _ __ __ _(_)_ __ __ _
| |_ / _` | __/ __| / _` | '_ \ / _` | / _` | '_ \ / _` | | '_ \ / _` |
| _| (_| | |_\__ \ | (_| | | | | (_| | | (_| | | | | (_| | | | | | (_| |
|_| \__,_|\__|___/ \__,_|_| |_|\__,_| \__,_|_| |_|\__, |_|_| |_|\__,_|
| |
Thursday, April 19, 2007
Make results more presentable
SAS regression output requires additional steps to make it presentable. In previous posts, I have highlighted how to only get the results for variables of interest. However, these results are in row format
Obs F1 or lci uci p_value
1 exp1 1.202 1.110 1.34 .001
2 exp2 1.340 1.202 1.56 .001
3 exp3 1.560 1.340 1.89 .001
4 exp4 1.890 1.560 1.98 .001
This output need to be further transposed in Excel to get the results in following format.
Obs exp0 exp1 exp2 exp3 exp4
1 1 1.2020 1.3400 1.5600 1.8900
2 1.11,1.34 1.202,1.56 1.34,1.89 1.56,1.98
3 0.0010 0.0010 0.0010 0.0010
The following program eliminates that
proc import datafile="C:\Documents and Settings\mkaushik\Desktop\Output results.xls" out=auto replace;
run;
data inter /* / view=intermediate*/;
set auto;
orc= put(or,6.4);
pvaluec= put(p_value,6.4);
new=compress(lci||','||uci);
output; *output the input record;
if _n_=1 then do;
F1='exp0';
or=1; *set values for your added obs;
lci=.;uci=.;p_value=.;
orc="1";
pvaluec=" ";
new=" ";
output; *output your added obs;
end;
proc sort;
by F1;
run;
data inter;
set inter;
array Value (*) orc new pvaluec;
do id =1 to 3;
_value_ = value [id]; * since first numeric is that date;
F1=F1;
output;
end;
drop or p_value _name_;
run;
proc print data=inter;
run;
proc sort data=inter;
by id;
run;
proc transpose data=inter out=outset(drop=id _name_) ;
by id ;
id F1 ;
var _value_;
run;
proc print data=outset;
run;
Thursday, April 5, 2007
Correspondence between genmod and logistic
I have been exploring this for my work. I found some guidance here. I am including some details here.
data drug;
input drug$ x r n;
cards;
A .1 1 10
A .23 2 12
A .67 1 9
B .2 3 13
B .3 4 15
B .45 5 16
B .78 5 13
C .04 0 10
C .15 0 11
C .56 1 12
C .7 2 12
D .34 5 10
D .6 5 9
D .7 8 10
E .2 12 20
E .34 15 20
E .56 13 15
E .8 17 20
;
proc genmod data=drug;
class drug;
model r/n=x drug / dist=binomial link=logit;
estimate 'A vs E' drug 1 0 0 0 -1/exp;
run;
proc logistic data=drug;
class drug/param=ref;
model r/n=x drug;
run;
/* generates dummy variables coded as follows
drug A 1 0 0 0
B 0 1 0 0
C 0 0 1 0
D 0 0 0 1
E 0 0 0 0 */
proc logistic data=drug;
class drug;
model r/n=x drug;
run;
/* generates dummy variables coded as follows
Class Value Design Variables
drug A 1 0 0 0
B 0 1 0 0
C 0 0 1 0
D 0 0 0 1
E -1 -1 -1 -1
*/
However, the results (Odds ratio) are going to be the same. Accessible help on writing contrast statements is here.
Monday, April 2, 2007
Proc tabulate/proc report
I have been trying to learn these new tools.
Here is a pdf with clear instructions and uses of both.
Some available options are ACROSS, ANALYSIS, CENTER, COLOR, COMPUTED, CSS, CV, DESCENDING, DISPLAY, EXCLUSIVE, F, FLOW, FORMAT, GROUP, ID, ITEMHELP, LEFT, MAX, MEAN, MEDIAN, MIN, MISSING, N, NMISS, NOPRINT, NOZERO, ORDER, P1, P10, P25, P5, P50, P75, P90, P95, P99, PAGE, PCTN, PCTSUM, PRELOADFMT, PRT, Q1, Q3, QRANGE, RANGE, RIGHT, SPACING, STD, STDERR, STYLE, SUM, SUMWGT, T, USS, VAR, WEIGHT, WGT, WIDTH.
Sunday, April 1, 2007
Macro to output only relevant results to ods
/** following macro runs logistic regression and outputs the results from only the relevant variables to the html file. In this case, I am running regression with various variables but keeping age in all the models. Age is not the variable of interest. */
%macro jncht(dataname,var1);
title "Age and sex adjusted &var1";
ods select OddsRatio ParameterEstimates;
proc logistic data=&dataname ;
model jncht=&var1 ahage ahsex ;
ods output OddsRatios=orrr;
ods output ParameterEstimates=Param;
run;
data param;
set param;
drop DF Estimate StdErr;
run;
proc sort;
by variable;
data orrr;
set orrr;
variable=effect;
drop effect;
proc sort;
by variable;
run;
data new;
merge param orrr;
by variable;
run;
%let cuts=%SUBSTR(&var1,1,4);
ods html select all;
title " age and sex adjusted &var1";
proc print data=new;
var variable OddsRatioEst LowerCL UpperCL ProbChiSq;
where variable like "%NRBQUOTE(%)&cuts%NRBQUOTE(%)";
run;
ods html exclude all;
proc datasets;
delete param orrr new;
%mend ;
Invocation of this macro.
/*include the following statement in the beginning of the program*/
ods html file ="%sysfunc
(reverse(%sysfunc(substr(%sysfunc(reverse(%sysfunc(reverse(%scan(%sysfunc(reverse(%sysfunc(getoption(sysin)))),1,/))))),5)))).html"
STYLE=MINIMAL;
data...;
.
.
.;
%jncht(trott1,&wstci_)
/*Where &wstci_ is a macro variable and equals 'wstci1 wstci2 wstci3'. */
Wildcards in different situations
This is a broad area to handle in one posting but here are few links that I found useful:
Using wildcards to read many files into one SAS data set
Matching with a wildcard using Perl regular expression A possible problem with this method is inability of this method to handle macro variables.
Matching with like and percent (%) It is used in the next post.
Using wildcards to read many files into one SAS data set
Saturday, March 31, 2007
Interactions in logistic regression using proc genmod
I have been trying to do logistic regression with interactions. Since this would have required a lot of dummy coding in proc logistic, I used proc genmod.
proc genmod;
class ahsex(ref=first) ah66a qtype &smok_ &alco_;
model jncht= wstrs wstrs*ahsex ahsex ah66a ahage &smok_ &alco_ WLTHINDF QTYPE/ error=bin link=logit type3;
run;
Another way to encode the interaction term and the main effects would be using "wstrs|ahsex". This equals "wstrs wstrs*ahsex ahsex".
The ref option could be replaced with (ref="1") . Specifying more than one REF= variable option in the CLASS statement could be a problem.
In case you are wondering, &smok_ refer to the macro variable I created earlier in the code as follows:
%let &sm0k= smok1 smok2 smok3 smokm;
Wednesday, March 21, 2007
Find the number of observations in the dataset
I work with huge daatsets - more than 100,000 observations followed up for 20 years. In the process of merging datasets read in through macros, I have lost track of the number of observations.
Following code gives the number of observations in the dataset - dataname:
%let dsid=%sysfunc(open(dataname));
%let num=%sysfunc(attrn(&dsid,nobs));
%let rc=%sysfunc(close(&dsid));
%put There are &num observations in dataset dataname.;
This is from the SAS samples.
Following code gives the number of observations in the dataset - dataname:
%let dsid=%sysfunc(open(dataname));
%let num=%sysfunc(attrn(&dsid,nobs));
%let rc=%sysfunc(close(&dsid));
%put There are &num observations in dataset dataname.;
This is from the SAS samples.
Monday, March 19, 2007
Centering around mean or calculating standard deviation
data original;
set original;
var=1; /*creates a constant variable*/
/*creates means ,standard deviation and no of obs and puts them in dataset called starwars which has only one observation*/
proc means data=original;
var ahbmi ah98 ah99 ah9900 ;
OUTPUT OUT=starwars MEAN=avbmi av98 av99 STD=stbmi stah98 stah99 N=nbmi n98 n99 ;
run;
data starwars;
set starwars;
var=1; /*creates constant variable for merging with original dataset*/
drop _freq_ _type_;
data original ;
merge original starwars;
by var;
centerbmi=ahbmi-avbmi; /*centers bmi*/
bmisd=ahbmi/stbmi;/*creates variable to do regression with each unit increment of standard deviation*/
/**************Alternate way***************************/
data original;
set original;
proc means data=original;
var ahbmi ah98 ah99 ah9900 hipcr;
OUTPUT OUT=starwars MEAN=avbmi av98 av99 STD=stbmi stah98 stah99 N=nbmi n98 n99 ;
run;
set original;
var=1; /*creates a constant variable*/
/*creates means ,standard deviation and no of obs and puts them in dataset called starwars which has only one observation*/
proc means data=original;
var ahbmi ah98 ah99 ah9900 ;
OUTPUT OUT=starwars MEAN=avbmi av98 av99 STD=stbmi stah98 stah99 N=nbmi n98 n99 ;
run;
data starwars;
set starwars;
var=1; /*creates constant variable for merging with original dataset*/
drop _freq_ _type_;
data original ;
merge original starwars;
by var;
centerbmi=ahbmi-avbmi; /*centers bmi*/
bmisd=ahbmi/stbmi;/*creates variable to do regression with each unit increment of standard deviation*/
/**************Alternate way***************************/
data original;
set original;
proc means data=original;
var ahbmi ah98 ah99 ah9900 hipcr;
OUTPUT OUT=starwars MEAN=avbmi av98 av99 STD=stbmi stah98 stah99 N=nbmi n98 n99 ;
run;
/*creates means ,standard deviation and no of obs and puts them in dataset called starwars which has only one observation*/


data _null_;
set starwars;
call symput("bmibar",avbmi); /*creates macro var bmibar that has the value of avbmi*/
call symput("a98bar",av98);
call symput("a99bar",av99);
call symput("s98",stah98);
call symput("s99",stah99);
call symput("sbmi",stbmi);
run;

%put mean of bmi is &bmibar;
%put mean of ah98 is &a98bar;
%put mean of ah99 is &a99bar;

data original;
set original;
ceterbmi=avbmi-&bmibar; /*centers bmi*/
bmisd=ahbmi/&sbmi; /*creates variable to do regression with each unit increment of standard deviation */
run;

/**************Alternate way***************************/
/**************Standardized Coefficients***************************/

proc reg;
model dependent= independent1 independent2 independent3/stb;
run;

This gives standardized estimates i.e. when all variables in the
models (including dependent variable) are standardized to zero
mean and unit variance. Each coefficient indicates the number
of SD change in the dependent variable with a SD change in the
independent variable holding constant all other variables constant.
This is useful to compare the relative importance of independent
variables independent of the scales.
Wednesday, March 14, 2007
Productivity tools for sas
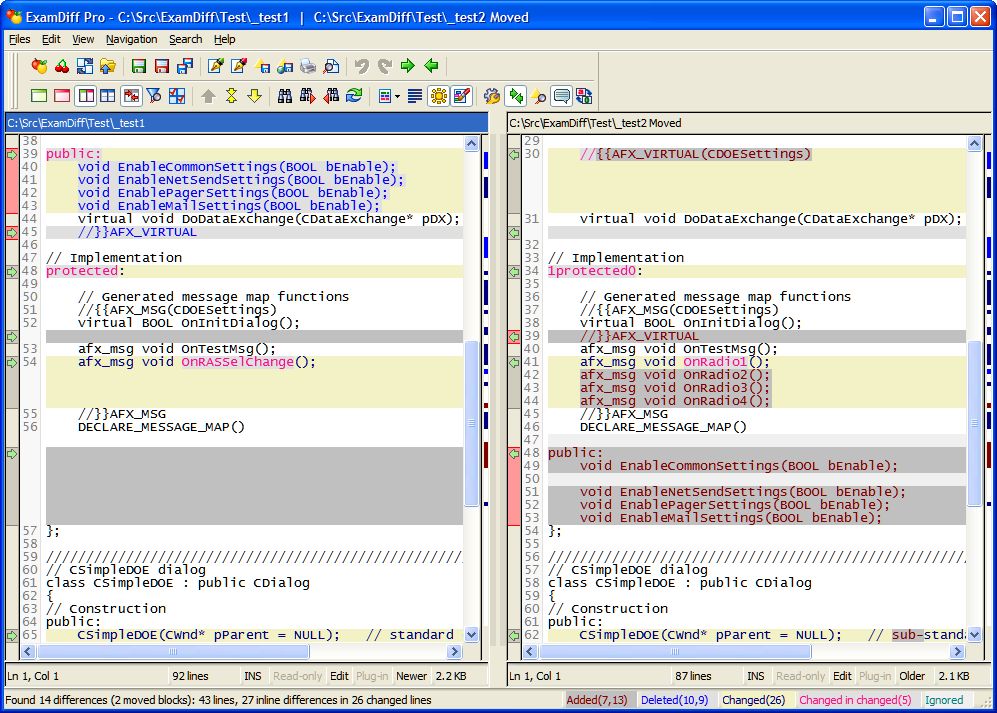
Comparison of two SAS programs: Sometimes similar looking files lead to different results. Following programs help finding the difference.
Beyond Compare
ExamDiffPro
Extracting columns of results from output e.g.

without painful editing as

TextPad
xemacs for windows
Beyond Compare
ExamDiffPro
Extracting columns of results from output e.g.

without painful editing as

TextPad
xemacs for windows
Thursday, March 8, 2007
Prevent code from executing
My sas programs have a lot of code which I need intermittently but I don't need it to run everytime the program executes. Since, I need the code from time to time, I am reluctant to delete it.
There are various ways to prevent code from executing:
/* this is sample code */
proc means;
table age;
run;
/* this is second proc */
proc univariate;
var age;
run;
If this code needs to be ignored as a whole, method 1 would generate a error and method 2 will be tedious. This kind of code can be prevented from executing as follows:
%macro abcdg;
/* this is sample code */
proc means;
table age;
run;
/* this is second proc */
proc univariate;
var age;
run;
%mend;
There are various ways to prevent code from executing:
- /*comment out using asterisk slash*/ pieces of code enclosed by asterisk slash are treated as comments by sas and ignored.
- *comment using asterisk; pieces of code enclosed by asterisk and ';' are treated as comments and ignored by sas.
- %macro junk; enclose code as a macro; %mend; pieces of code enclosed as macro are ignored. This is extremely useful since method1 and 2 only work if there are no other comments in between. Junk can be replaced with any word.
/* this is sample code */
proc means;
table age;
run;
/* this is second proc */
proc univariate;
var age;
run;
If this code needs to be ignored as a whole, method 1 would generate a error and method 2 will be tedious. This kind of code can be prevented from executing as follows:
%macro abcdg;
/* this is sample code */
proc means;
table age;
run;
/* this is second proc */
proc univariate;
var age;
run;
%mend;
Monday, March 5, 2007
Find missing information
Missing information bugs me! Missing missing information bugs me more!!
However, there is an easy way to find variables with missing information. This method can be used for both continuous and categorical variables. Try the following after changing the keywords in color with your data specific names.
However, there is an easy way to find variables with missing information. This method can be used for both continuous and categorical variables. Try the following after changing the keywords in color with your data specific names.
proc means data=trott1 NMISS N ;More detailed information is available here.
var sbp dbp age smoking alcohol;
run;
Sunday, January 7, 2007
Using Proc Genmod for logistic, poisson and log binomial regression
PROC GENMOD is a procedure for fitting generalized linear models. This procedure is flexible and offers various advantages.
Indicator variables do not have to be constructed in advance because it uses a class statement for specifying categorical (classification) variables.
Interactions can be fitted by specified by using asterisk, for example, batch*gender.
In some procedures, variables necessarily have to be numerical. However, in proc genmod, the variables (both outcome and explanatory) can be character.
Proc genmod reports log likelihood ratio for each variable in the model.
Because of the generalized nature, different models can be fitted with one procedure.
data file11;
/* generate data using random numbers. details here*/
DO MINUTE=0 TO 1000 BY 1;
X=UNIFORM (0);
X1=UNIFORM (15452);
X2=UNIFORM (29561);
OUTPUT ;
END;
run;
data filea;
set file11;
if x>0.5 then gender=1;
if x<=0.5 then gender=0; if x1>0.8 then emmig=1;
if x1<=0.8 then emmig=0; if x1>0.8 then emmig1='yes';
if x1<=0.8 then emmig1='no'; if x2>0.4 then cat=1;
if x2<=0.4 then cat=0;  id=_n_; /* following creates a compressed/collapsed dataset (fam8)
with the same information as original dataset*/
if cat=0 then do;
if gender=1 and emmig=1 then index=1;
if gender=0 and emmig=1 then index=2;
if gender=1 and emmig=0 then index=3;
if gender=0 and emmig=0 then index=4;
end;
else if cat=1 then do;
if gender=1 and emmig=1 then index=5;
if gender=0 and emmig=1 then index=6;
if gender=1 and emmig=0 then index=7;
if gender=0 and emmig=0 then index=8;
end;
PROC MEANS DATA=filea NWAY NOPRINT ;
CLASS index gender emmig cat emmig1;
VAR index ;
OUTPUT OUT=fam8 SUM=number;
RUN;

data file;
set fam8;
drop _type_ number;
numb=_freq_;
id=_n_;

/* Calculate odds ratio using logistic regression */
proc genmod data=file descending ;
class cat ;
freq numb; /* method to analyze aggregate data */
model emmig1 = cat/ dist=binomial link=logit ;
estimate 'Beta' cat 1 -1/ exp;
run;

/* Calculate risk ratio using log binomial regression */
proc genmod data=filea descending ;
class cat ;
model emmig = cat/ dist=binomial link=log ;
estimate 'Beta' cat 1 -1/ exp;
run;

/* Calculate risk ratio using Poisson Regression with Robust Error Variance*/
proc genmod data=filea ;
class cat id;
model emmig = cat/ dist=poisson link=log ;
repeated subject = id/ type = unstr;
estimate 'Beta' cat 1 -1/ exp;
run;

/*logic of using risk ratio vs odds ratio and details of log-binomial and
poisson regression is here*/
Subscribe to:
Posts (Atom)